How to Download, Install and Use Microsoft Excel 365 for Free
Installation:
- To get started, click “Download” to download the Microsoft Excel from DownloadAstro:
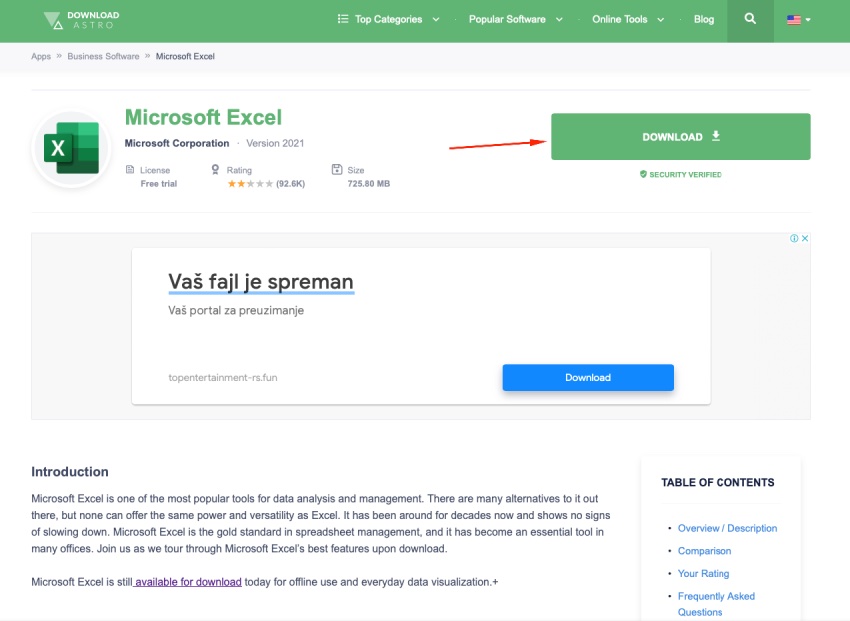
- Then click the “Download” button on the next page (this is where our system identifies your requirements):

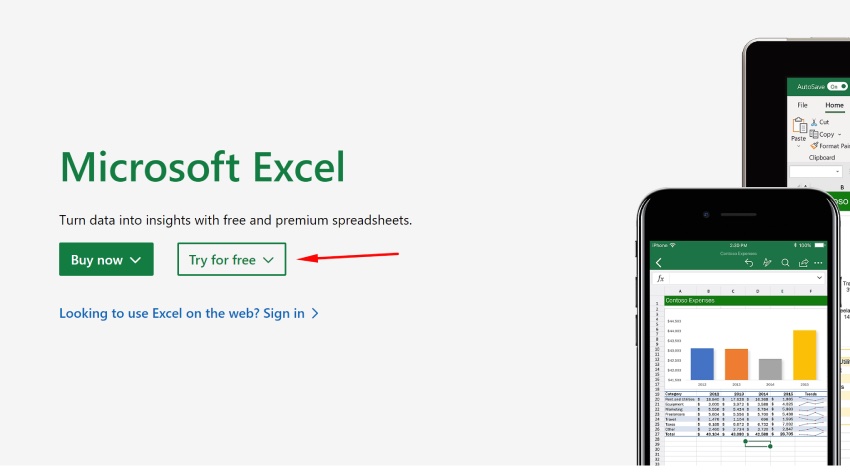
- You will then be taken to the official app website where you can click the “Try for free” button:
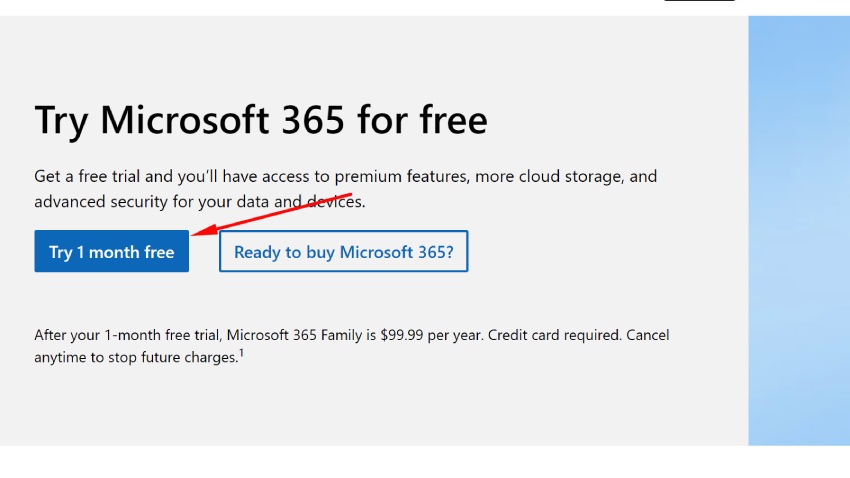
- And then choose the “Try 1 month free” option:
- Since this is the official program, it will require you to sign in (create) to your Microsoft account:

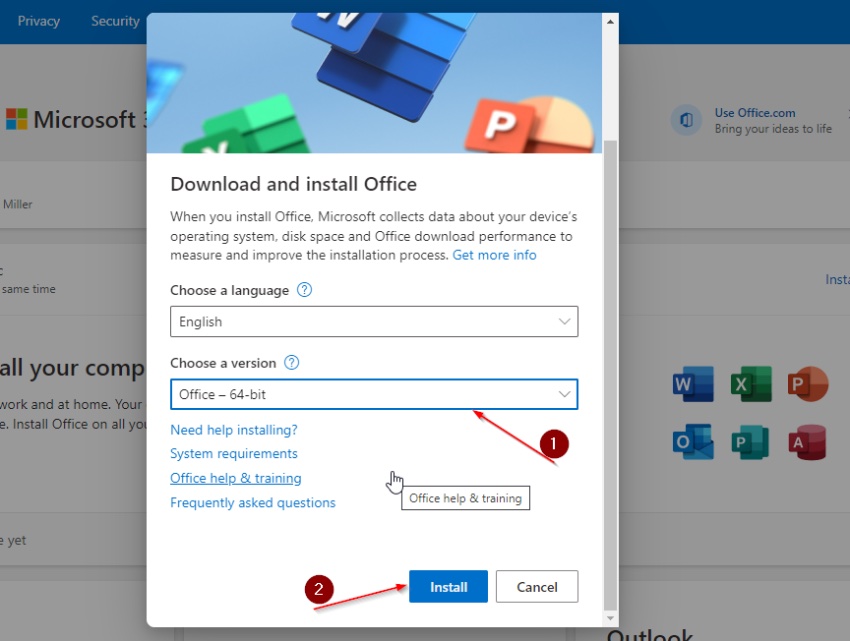
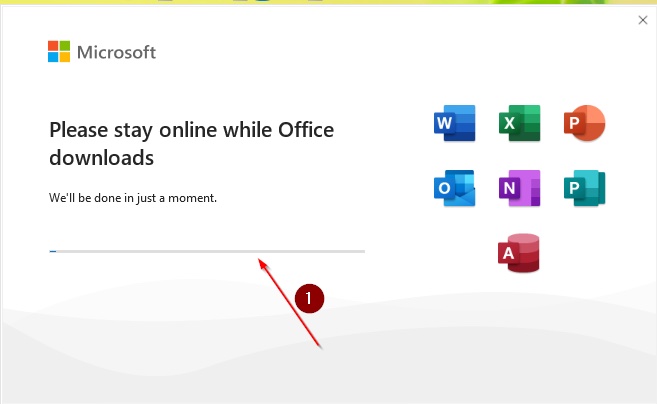
- Once logged in, you’ll be given the option to install the app for free:

- You’ll be given a number of options, and these are the ones you need to choose:
- Now that you’re done installing it on your device, hit the “Close” button and begin using Excel for free
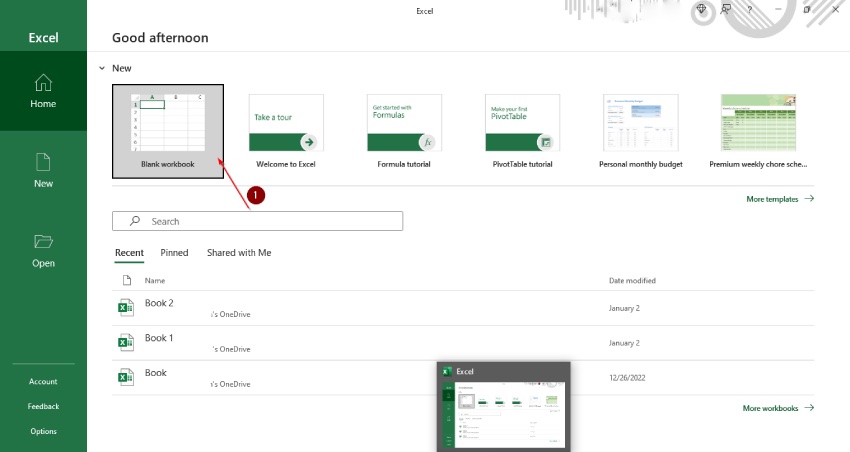
- Try using it by creating something in “Blank workbook.” Then you’re good to go!
Microsoft Excel is one of the most popular tools for data analysis and management you can download at DownloadAstro. There are many alternatives, but none can offer the same power and versatility.
Microsoft Excel has been around for decades and shows no signs of slowing down, it’s a gold standard in spreadsheet management, and it has become an essential tool in many offices. Join us as we tour through its best features and powerful functions.
MS Excel 365 Core Features:
There are many features in MS Excel that allow you to create useful and fancy reports.
- Nested IFs – to build complex calculations
- AutoFill – for data range expansion, creation of tables and graphs
- Mathematical functions (SUM, AVG) – for calculation of data values with different criteria
- Conditional Formatting – to highlight cells based on their contents or value ranges
Nested IFs
Nested IFs are one of the most powerful, yet underutilized features of Excel. When you have multiple conditions to check and want them all to be true, nested IFs can be used. An example of this would be if you wanted to check if the user was an admin or not, but also make sure they entered their email correctly. You could use two separate IF statements like this:
- If (“ADMIN” = “YES”) And IsNumeric(A1) Then
- GOTO A1:INTRO
AutoFill
AutoFill is a feature that fills cells with values based on the contents of other cells in the same column or row. You can use AutoFill to fill sequential numbers, dates, and formulas into cells.
Mathematical Functions (SUM, AVG)
There are a number of functions in Excel that help you work with numbers and perform calculations. The most basic function is SUM, which sums all values in a range of cells. An example is shown below:
The formula simply adds up all the values in C3:C9 (the blue area above) and returns their sum as the value shown in cell C10 (the red area).
AVERAGE is used to calculate the average of a range of cells–in this case we’ve calculated an average price per item by adding together prices and dividing by the number of items sold. The formula used in B9 is shown below:
We can also use AVERAGEIF and AVERAGEIFS to calculate averages based on multiple conditions; for example, let’s say we want to know how much profit we made from selling our product depending on what type of customer bought it (i.e., if someone who bought more than 10 units at over $1 each purchased them). In B10:B14 we’ve calculated how much money was taken in from each sale using SUMIFS; then grouped those results by customer type using IF statements before calculating each group’s profit margin separately with AVERAGEIFS
Conditional Formatting
Conditional formatting is a feature that allows you to highlight cells based on specific criteria.
This can be used to make your data more visually appealing, and it can also be used to make the data easier to read. Conditional formatting is often used to highlight important information, but it can also be used for other things like highlighting the highest and lowest values in a dataset, or creating conditional formats that prompt users when they try to enter invalid data into your sheet.
Charts
Charts are used to visualize data and make decisions. They can also be used to present data visually, making it easier for you and others to understand the information that’s being presented.
When you create a chart, Excel will automatically detect the type of data in each column or row, and then display that information using a visual representation. For example, if there are numbers in one column and dates in another column, Excel will make both columns into vertical bars so that each category is represented by its own bar with different heights on either side depending on its value:
Advanced features of MS Excel:
The experts at DownloadAstro have also compiled some key advanced features of Microsoft Excel 365, which you might find handy:
Macros (VBA)
Macros are a set of commands that automate certain tasks. You can use them to create custom menus, workbooks, userforms, and add-ins for your Excel file.
You can write VBA code in the Visual Basic Editor (VBE). The VBE is an integrated development environment (IDE) for writing macros in MS Excel.
You can write macros using the VBA language which consists of keywords like Sub and End Sub, Constants and Variables etc..
Power Pivot (Data Model)
- Power Pivot is a data modeling feature in Excel that allows you to create and manage large, multidimensional data models by using the same familiar Excel interface.
- Power Pivot for Excel 2010 is meant for analyzing large volumes of data in an organization’s information warehouse or data mart. PowerPivot benefits from the work done by Microsoft SQL Server 2008 R2 Analysis Services (SSAS) on tabular mode, as well as Windows Azure Table Storage service to make it possible to store large amounts of structured content without compromising on performance or availability.
Power Query (Get & Transform)
Power Query (get & transform) is a powerful data transformation tool that provides a data modeling experience. It can connect to multiple data sources, and it can transform data from one format to another. Power Query is included in the Power BI Pro suite.
Why Download Microsoft Excel 365 – Pros
Simplicity & Ease of Use for Basic Calculations / Data Analysis.
Microsoft Excel is a great tool for basic calculations and data analysis. It’s simple to use, and you can get up and running quickly.
It does not have the power that other options have, however. For example, advanced functions like Monte Carlo simulation are not available in Excel (though they are in R).
Feature-Rich Tool Available for Complex Analytical Problems.
The feature-rich tool of Excel can handle complex analytical problems. Power Pivot and Power Query are two of the most powerful features in Excel. Using Power Pivot, you can create a data model to store your data and create complex calculations for analyzing it. With Power Query, you can extract data from various sources such as text documents or web pages and import them into a spreadsheet with just one click.
Alternatives to MS Excel include:
If you’re looking for an alternative to MS Excel, consider the following options:
- OpenOffice and Google Sheets are both free online spreadsheet applications that allow you to create and edit spreadsheets online. They don’t offer all of Excel’s functions, but they do come close. For example, they don’t allow macros (programs) within their apps; however, they do have formulas and functions similar to those in MS Excel. These two apps also provide templates for common business needs such as income statements, invoices and checklists.
- LibreOffice is another free alternative with many features found in MS Office products such as Word and PowerPoint. Download it here on DownloadAstro.com!


