Today’s technology has come a long way; once considered science fiction, terms like “cloud computing”, “Internet of Things” (IoT), “Artificial Intelligence” (AI), and “Big Data” are now commonplace and, more importantly, they’re a reality.
There’s a lot of information behind cloud computing and it can get confusing pretty easily. For this reason, we’ve made this cloud computing infographic to explain the basics and everything related to cloud computing services to help you better understand it all.

What Exactly is Cloud Computing?
Cloud computing involves delivering different computing services or resources over an online network of servers and software, known as a “cloud”. Basically, instead of buying, owning, or maintaining a physical space that’s located in one area, you create a virtual space that can be accessed from anywhere.
The services available from cloud computing are numerous and can involve server storage, networking, databases, software, analytics, and intelligence. A user can even choose to have a service on an as-needed basis and pay only for the services selected from a cloud provider.
All this helps reduce operation and maintenance costs and increase overall efficiency and scalability.
Cloud Computing Data Centers
Cloud data centers are based off-premises, instead hosted by cloud service providers. Cloud data centers dominate workload processing across the world, having processed 94% of all data of workloads in 2021-2022. Cloud data centers are one necessary component by which we can share, upload, or access cloud data from anywhere with an internet connection. Cloud service providers have a wide range of servers and data centers in multiple locations, so it’s easy to underestimate just how important they are.
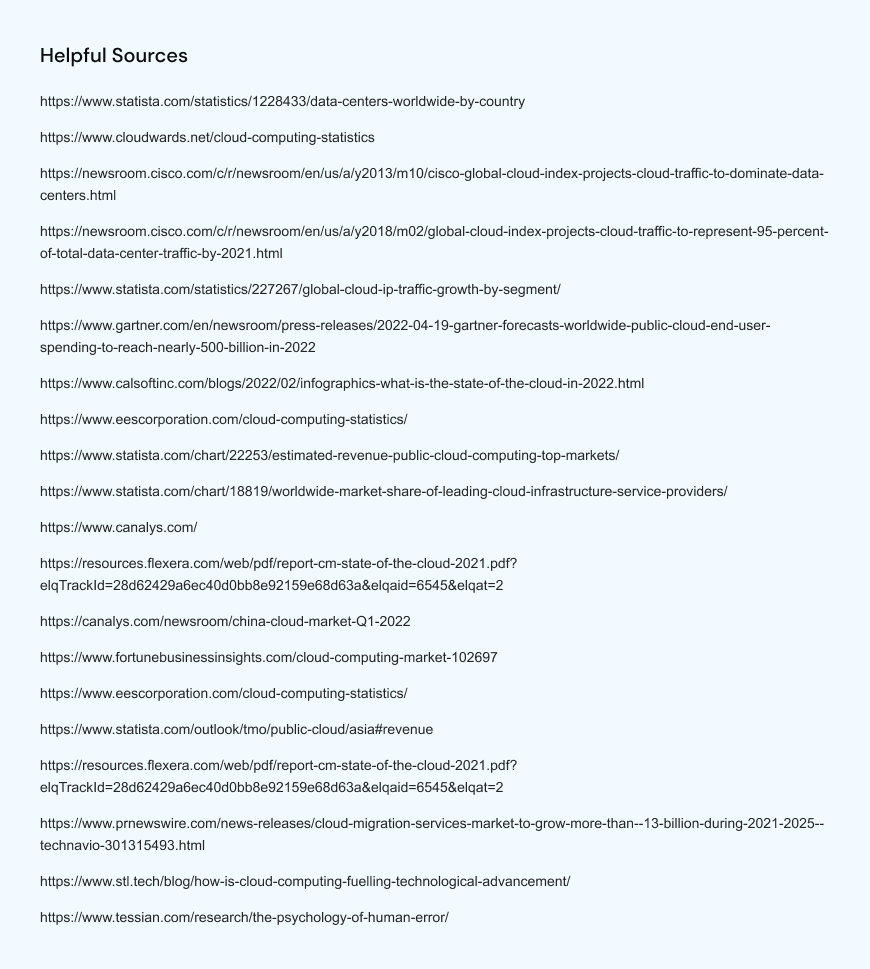
In the USA especially, the scale of data center production and infrastructure is striking. The US has over 5X more data center locations than any other country. It might surprise some readers that only two Asian countries round out the top 8 countries with the most data centers, with various European countries being strong in this area.
- The USA leads the way with over 2,700 data centers – over 5x more locations than Germany, its nearest competitor, at 484
- Of the top 8 centers, 5 are located in Europe: U.K., Germany, Netherlands and France.
- Despite the large cloud market size in Asia (over $59B in 2021), China and Japan only have around 650 centers between them.
But what about the world’s largest individual center? The numbers might shock you! It’s located in Nevada, USA, and is owned by the company Digital Reality. In total, the center occupies the same space as over 2,500 tennis courts.
- The data center is located in Tahoe Reno, Nevada, USA, and it is called the CITADEL campus.
- Its built facility covers more than 1.3M square feet – with the full campus totalling over 7.2M square feet!
As international data center demand has grown, so too has its capacity. A 2017 survey showed that 63% of all data workloads had been processed by cloud data centers. This number climbed to over 94% in 2021! This is reflected by global IP traffic for data centers, which rose from 8,190 exabytes in 2017 to 19,509 in 2021. Evidently, the cloud data center sphere is showing no signs of slowing down. 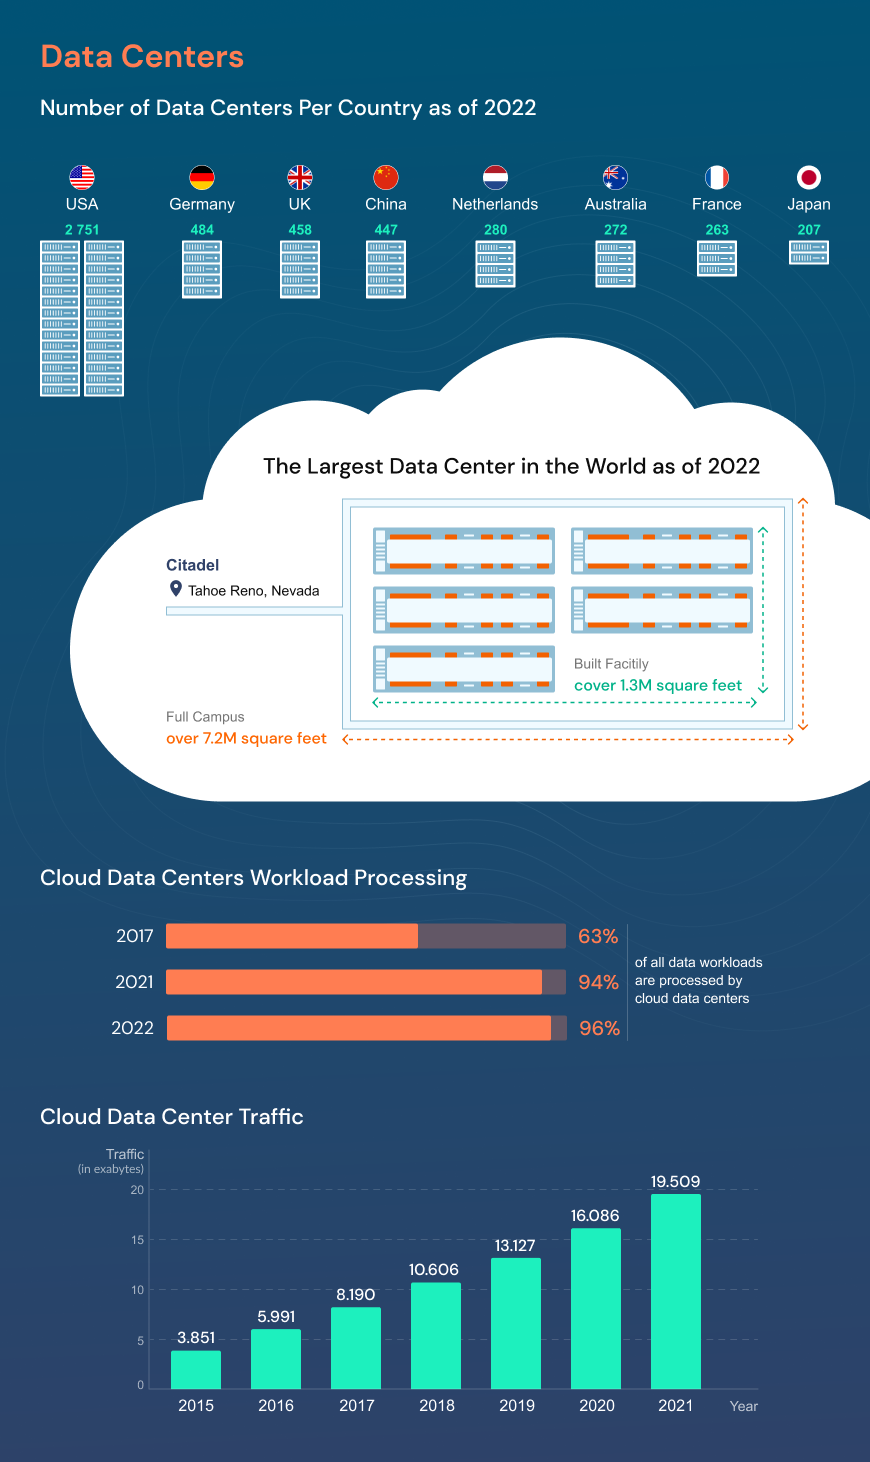
Cloud Computing Users
From single users to large organizations, almost everyone is using cloud computing. Famous applications and organizations like Google, Apple, Microsoft, and Meta all take advantage of cloud computing. For example, FinTech companies benefit from real-time fraud detection and prevention services, all thanks to the cloud. Now let’s take a deeper look into some facts and stats about cloud computing users:
There is a general trend of startling growth across public cloud services spending. In 2021, the USA’s public cloud services user spend exceeded $410.9 billion, already a significant amount. However, that amount has been projected to exceed $494.7 billion in 2022! By the end of 2023, some sources expect that the US total user spend will sit at over $600 billion. A new 50% growth in two years is almost unprecedented, but highlights the speed at which the industry is progressing. Some of the major players in this change include:
- Google Drive: over 1 billion users from 2018
- Google Workspace: over 2 billion users from 2020
- Dropbox: over 700 million users currently
From our reports, it seems clear that companies appreciate the importance of streamlined and cost-efficient cloud services. Over 70% of businesses surveyed believe moving operations and workloads to the cloud is a highly important move. Similarly, 50% organizations would prefer cloud-first business strategies, evidencing a shift in business priorities over the last decade.
This might reflect post-Covid working preferences. Only a 1/4 of workeres prefer fully in office work, with just over 25% preferring fully remote. Intriguingly, almost 1/2 of users prefer hybrid work, requiring a mix of onsite and offsite data processing.
Cloud Computing Market Statistics
While the US’s market share continues to grow, so too does the influence and expenditure of private companies. While Amazon, Google and Azure lead the way, we have also seen significant growth across various Chinese companies. Some of the revenue forecasts for public cloud computing services are striking.
Revenue Forecast: Public Cloud Computing Services 2022
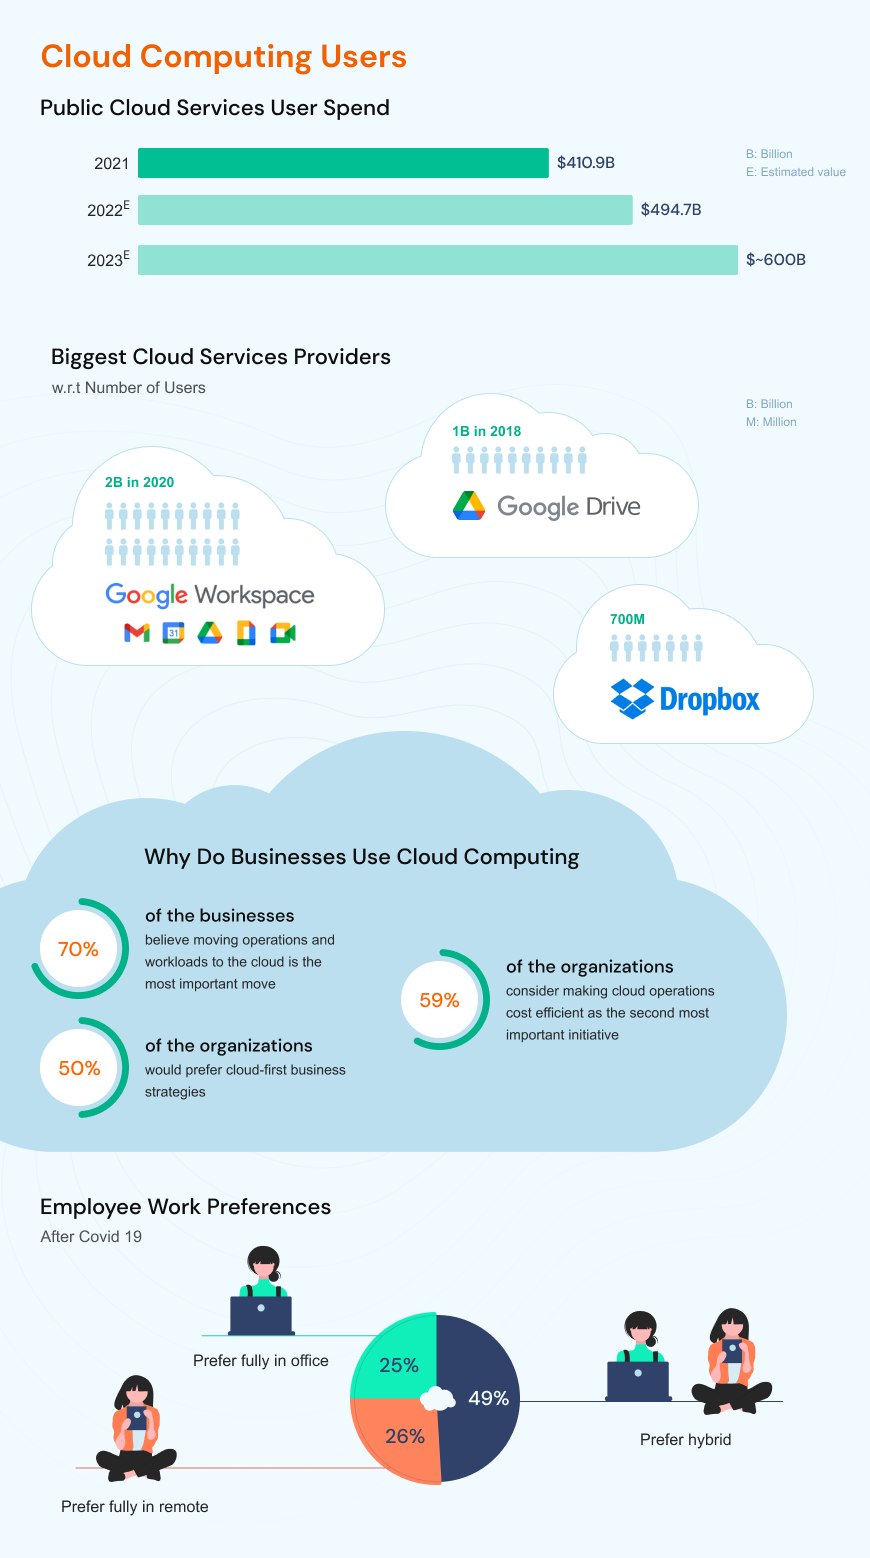
In terms of per country revenue, the USA leads the way, with over 6x the revenue forecast of its nearest competitor, China. In fact, besides the top 5 countries, the rest of the world combined only generates a revenue of $114.9 billion for public cloud computing services, just over half of the US’s revenue:
- The USA leads the way with a $206.1 billion dollar revenue forecast. China, its closest competitor, stands at just $35 billion dollars.
- The U.K. ($18.3 billion), Germany ($18.2 billion) and Japan ($15 billion) round out the top 5, totalling $51.5 billion dollars between them!
- The rest of the world combined gathers a total revenue forecast of $114.9 billion, almost half of the United States’ forecast alone.
Worldwide Cloud Infrastructure Market Share
However, the revenue streams of large companies are also striking. AWS’s 2021 revenue more than tripled the U.K.’s public revenue forecast, and we can see startling year-on-year growth across three of the largest companies: AWS, Microsoft Azure and Google Cloud.
- Amazon Web Services’ revenue was as high as $62 billion in 2021, with a staggering Y.O.Y growth of 37%. Perhaps this reflects the fact that AWS serves 190 territories, and is the oldest of the three top companies – having been founded in 2006.
- Microsoft Azure gathered a total revenue of $60 billion in 2021, while serving only 140 territories. Nonetheless, Azure matches AWS’ volume of services, offering over 200!
- Google Cloud rounds out the top 3, with a total revenue of $19 billion in 2021, despite displaying a 35% Y.O.Y growth. This comes as little surprise, given Google Cloud offers under half the services offered by its two top competitors.
Worldwide Cloud Spending
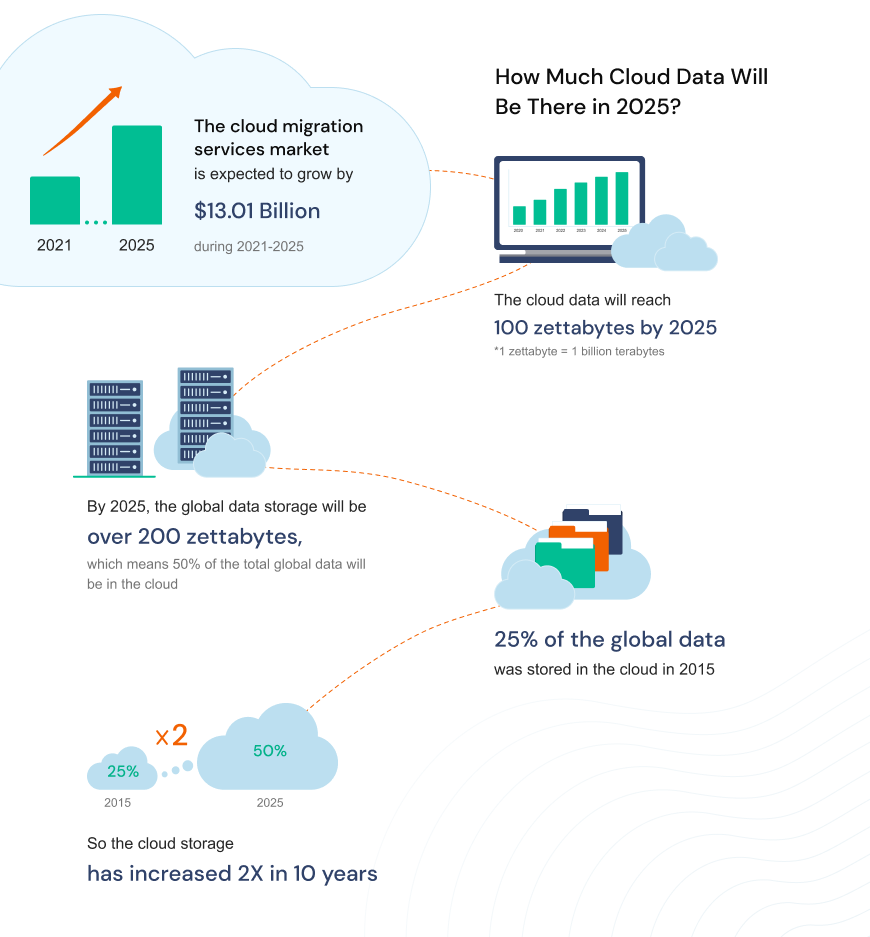
As revenues have increased globally, so too has spending. Worldwide cloud infrastructure spending has increased by over 20% within the last year, and projections continue to show consistent quarterly rises – from $41.8 billion in Q1 of 2021, through to $62.3 billion in Q2 of 2022. This trend might be reflected when analyzing cloud spend by enterprises – 36% of enterprises spend a whopping $12 million+ on cloud services annually, with a further 50% spending at least seven figures annually. However, enterprises are right to spend so much – cloud data volume could reach 200 zettabytes by 2025 (1 zettabyte = 1 billion terabytes!). This could mean over 50% of global data being in the cloud – a twofold increase from just 10 years ago!
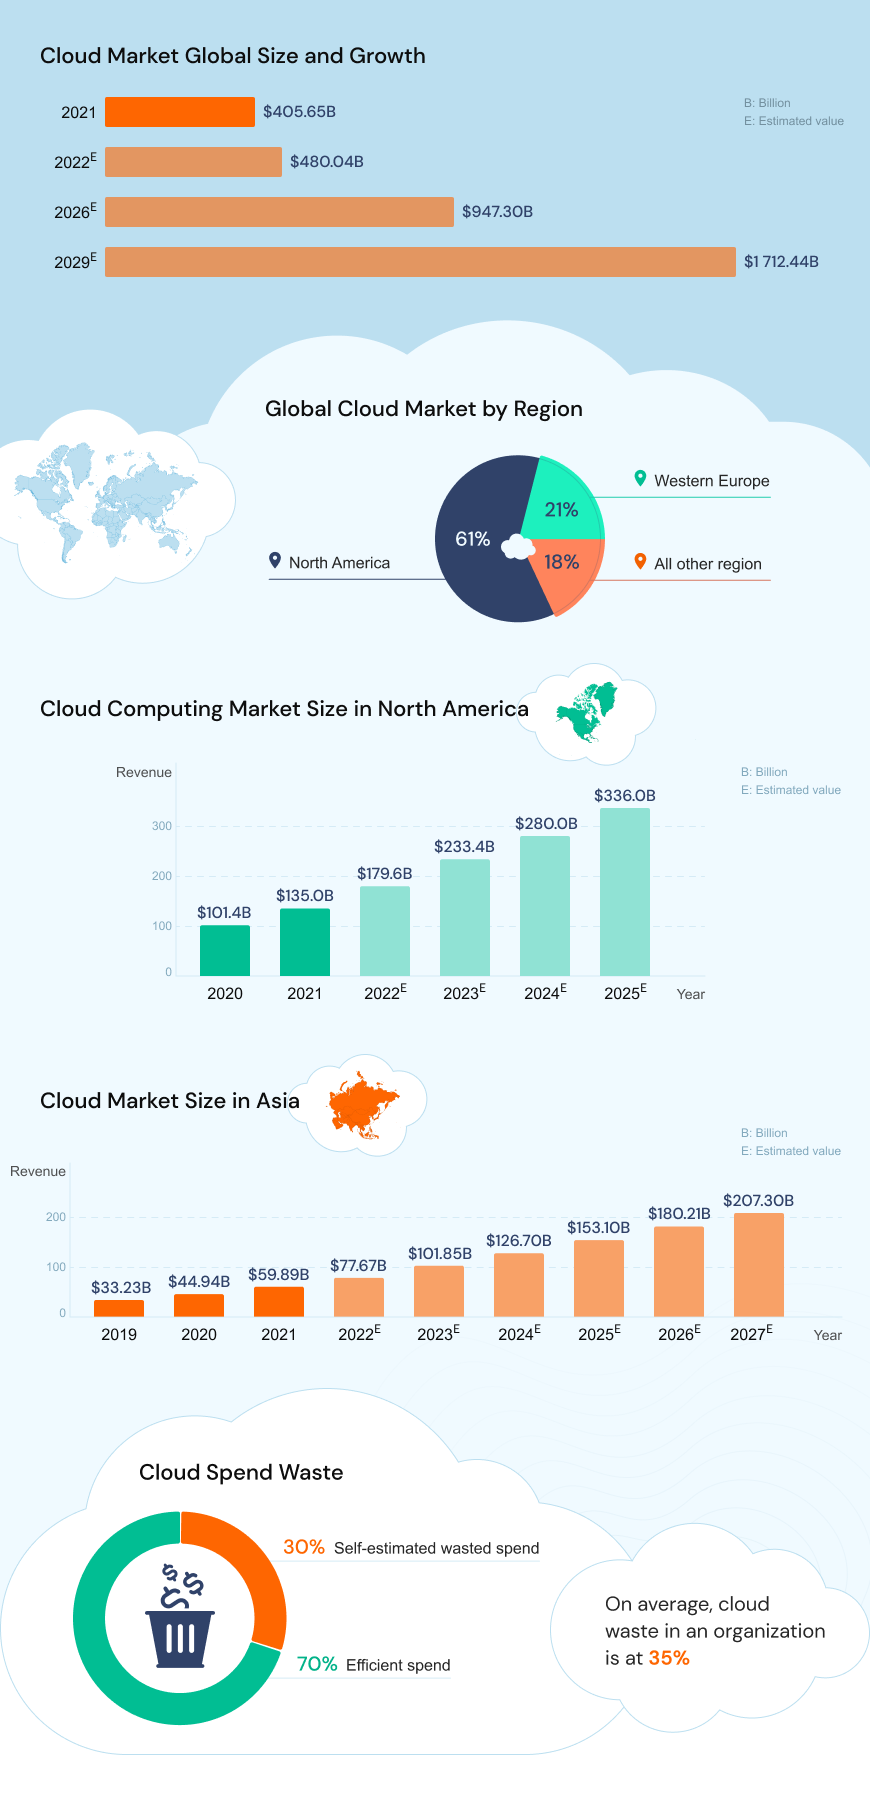
Global Cloud Market Size and Growth
- The global market size in 2021 was $405.65 billion, whereas in 2022 it’s been predicted to rise sharply to $480.04 billion
- That number will shoot up to $947.3 billion in 2026, with predictions estimating that the market will reach as high as $1712.44 billion in 2029
Regional Market Facts and Stats:
North America and Western Europe dominate the cloud market sphere, with 6% and 21% of the market share respectively. All other regions combined total in at 18%. However, we are seeing clear growth within the Chinese private sector, with Alibaba Cloud leading the way. This reflects revenue forecasts for public cloud computing services – it seems that the US and Europe are way ahead of the competition for the moment; but this could change over the next few years:
- In North America, the cloud market is predicted to reach $336 billion in 2025, almost double the 2022 total of $179.55 billion.
- In Asia, there will be an approximate threefold growth between 2020 and 2025 – with 2020’s total market size of $44.94 billion dwarfed by 2025’s predicted rate of $153.1 billion.
- Across all regions, the average rate of cloud wastage is at 35%.
Cloud Computing Security Statistics
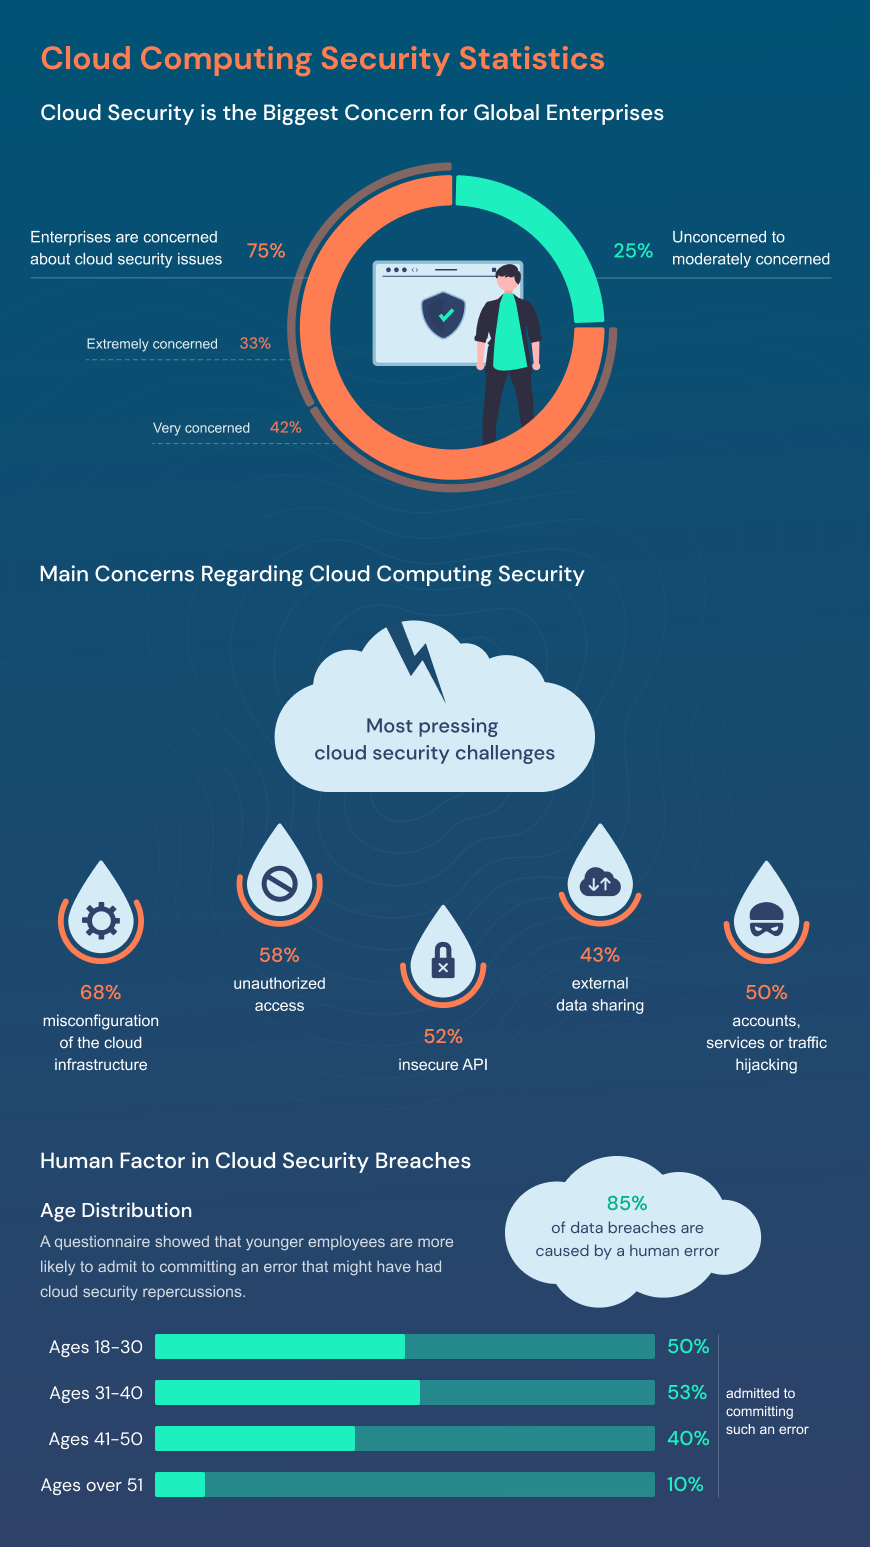
Cloud security is one of the biggest concerns for global enterprises. As cloud computing systems become more complex and more prevalent, the importance of data security only increases. We’ve crunched some of the stats about how enterprises and companies are approaching the issue of cloud computing security.
So, are companies concerned about cloud security issues? Quite resoundingly, the answer is yes. 75% of enterprises surveyed claimed that they are concerned about cloud security issues, with around 33% going so far as to say they are extremely concerned and 42% stating that they are very concerned.
In contrast, only ¼ of businesses are unconcerned or moderately concerned about cloud security issues, constituting a clear minority of enterprises. Clearly, businesses are beginning to take the issue of cloud security seriously.
These companies also outlined their most pressing concerns about cloud security. Here are some of the most interesting takeaways:
- The most pressing cloud security challenge was deemed to be misconfiguration of the cloud infrastructure, with 68% of respondents agreeing on this point.
- Just behind misconfiguration issues lies concerns around unauthorized access (at 58%) and insecure APIs (at 52%).
- Rounding out the list were concerns around accounts, services or traffic hijacking issues (50%) and external data sharing (43%).
- However, few respondents seemed to share concerns about the human factor in breaches: around 85% of data breaches are in fact caused by human error.
On a final note – the survey drew interesting stats about the role of age in admitting to cloud security breaches. One questionnaire showed that younger employees are more likely to admit to committing an error that might have had cloud security repercussions. Of those who admitted to committing a cloud security error: 50% were aged 18-30, whereas only 10% of those aged over 51 could say the same!
Final notes
Businesses today are looking for innovative methods to grow and meet their goals; many organizations are therefore migrating their critical workloads to clouds to keep up with the current trends of growth, scalability, privacy, and low latency.
Cloud computing continues to grow as it continues to play a bigger role in the functions and needs of both businesses and customers.
Key Takeaways
- Cloud computing has arguably become an everyday necessity.
- Cloud computing services cater to business, home, and private use.
- Cloud computing statistics show that the cloud is the future of the Internet.
- The cloud computing infographic presented shows how cloud computing is evolving.