iOS and Android – Two kings of the OS world
Did you know that there are now over 6.7 billion smartphone users worldwide? That’s quite a steep rise, considering there were fewer than 2 billion active users in late 2016!
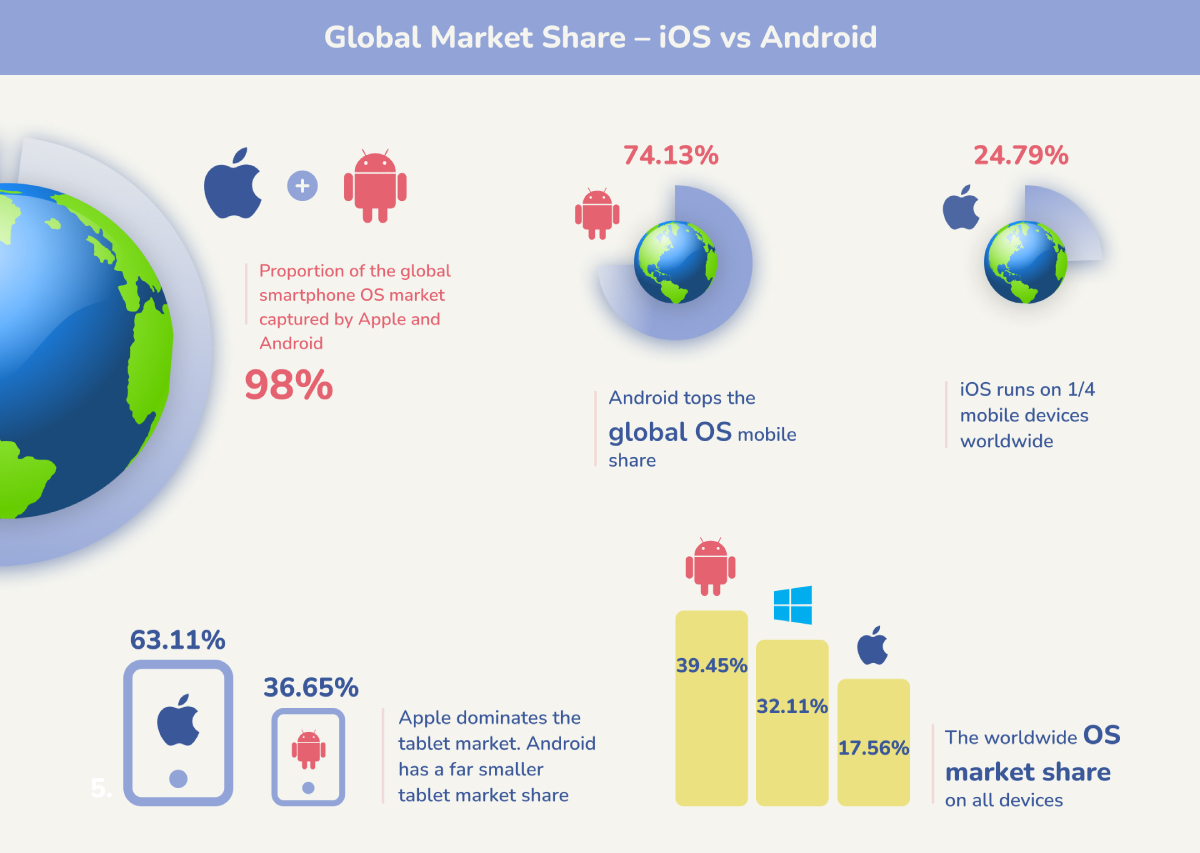
Both iOS and Android entered the market in 2007, and since then, their rise and market penetration has been meteoric. A staggering 98% of smartphones are run by these two operating systems.
One key reason for their success: Google owns Android, and Apple owns iOS – both are trillion-dollar companies with unmatchable resources. But there is certainly more to their success than just riches.
They make users fall in love with their usability and functionality, perhaps pointing to why there haven’t been any competitors worth mentioning against these two industry giants. But what about a head-to-head comparison between these two? How do they compete against each other in the market today?
The dominance of both Android and iOS is clear. A third OS isn’t even in the picture.
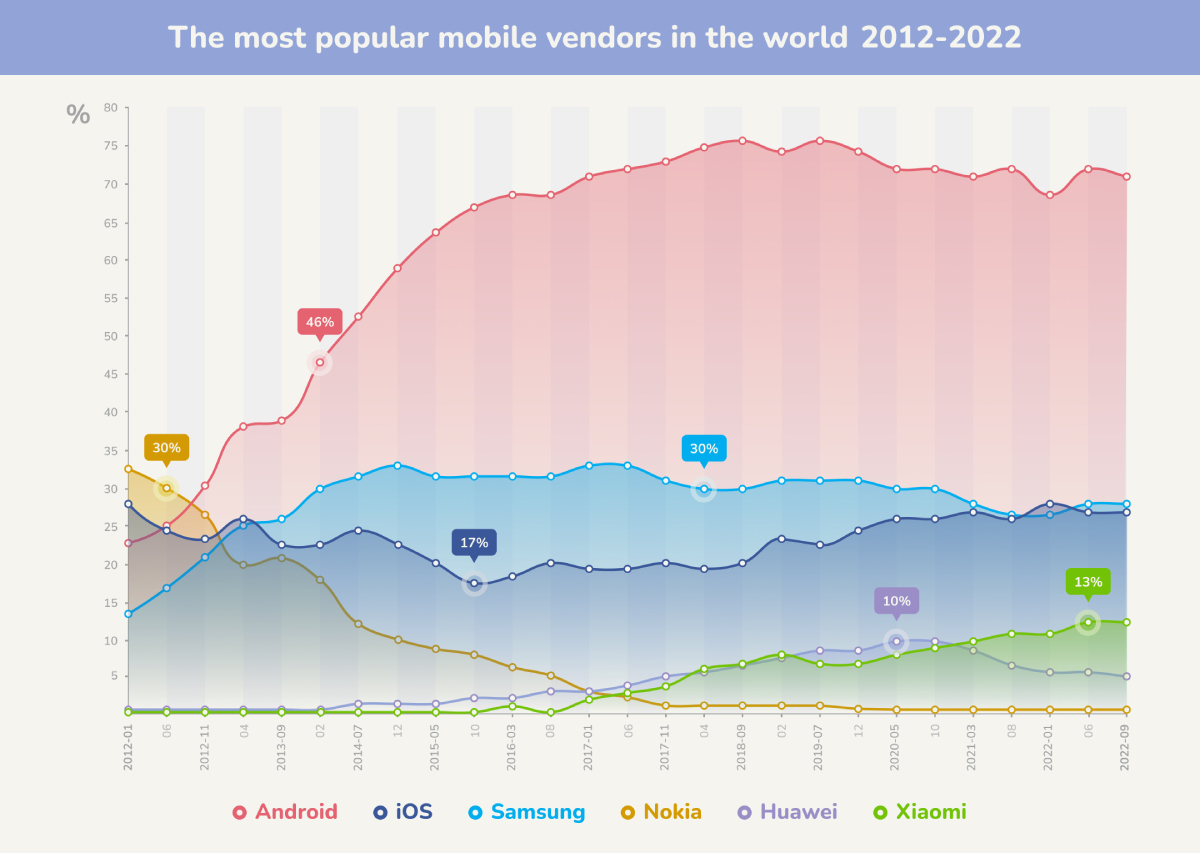
Here are some Android vs iOS market share numbers to give you an idea about how the two operating systems are performing around the global market.
- Android is the biggest OS in the world with more than 70% market share. iOS is second with an almost 25% market share.
- Android keeps growing in the emerging markets as well as in the developed markets. But there is one big exception – China!
- The iOS market enjoys promising growth in markets like the USA, Japan, UK – all developed markets.
- Older versions of Android OS are more popular among Android users. iOS users prefer the latest versions.
- Google Play Store and iOS App Store made almost $34 billion in the last quarter of 2021.
We’ve crunched the stats and numbers so that you don’t have to – read on for some of our key takeaways from Android and Apple’s success!
1: Android is the biggest OS in the world
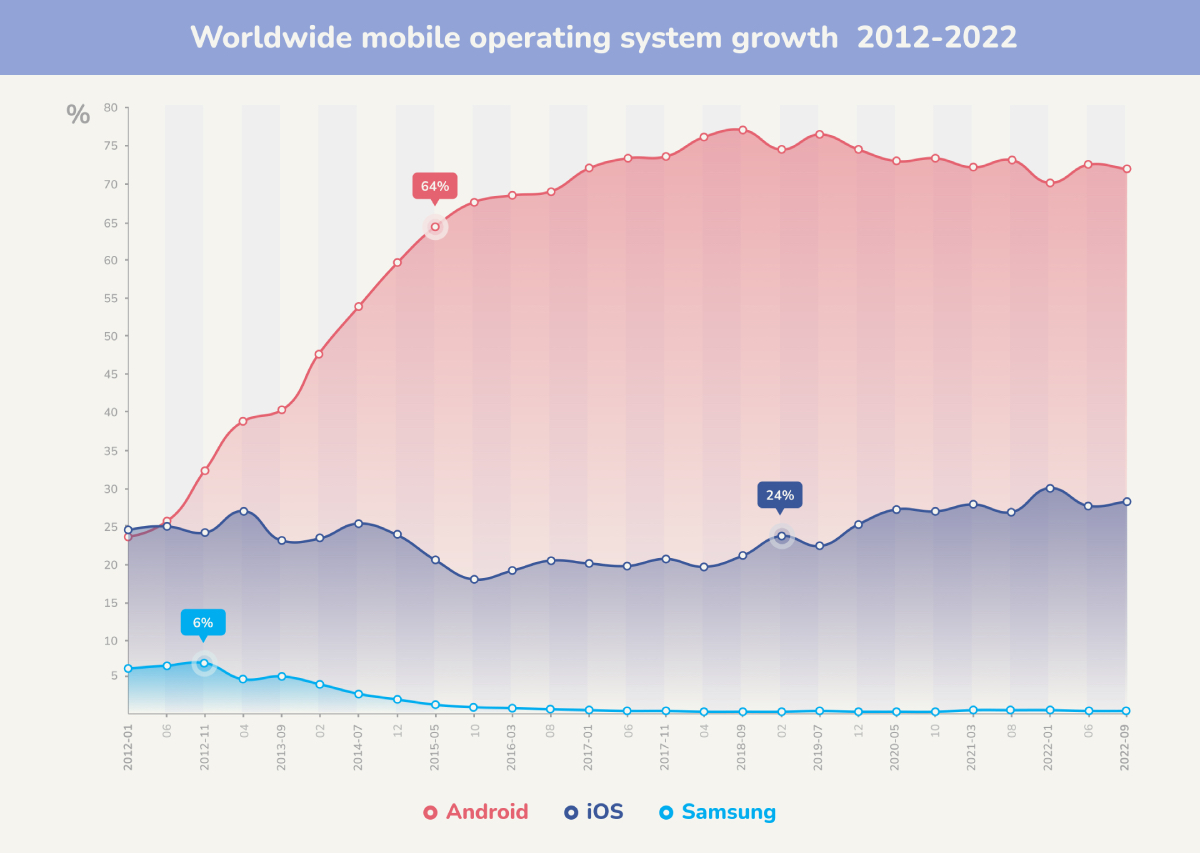
Android is the biggest OS in the world for mobile devices, with various data sources proving this.
iOS comes second, but the market share difference is visibly wide. According to statistics, the Android vs iOS market share stands at 72.2% and 26.99%.
Both iOS and Android were launched to the public around the same time. Apple caught most of the initial market and Android’s share was just 10% in 2009.
But that doesn’t mean iOS lags behind in any way. iOS keeps a considerable global presence and despite having less market share as compared to Android, the revenue stream is larger than Android.
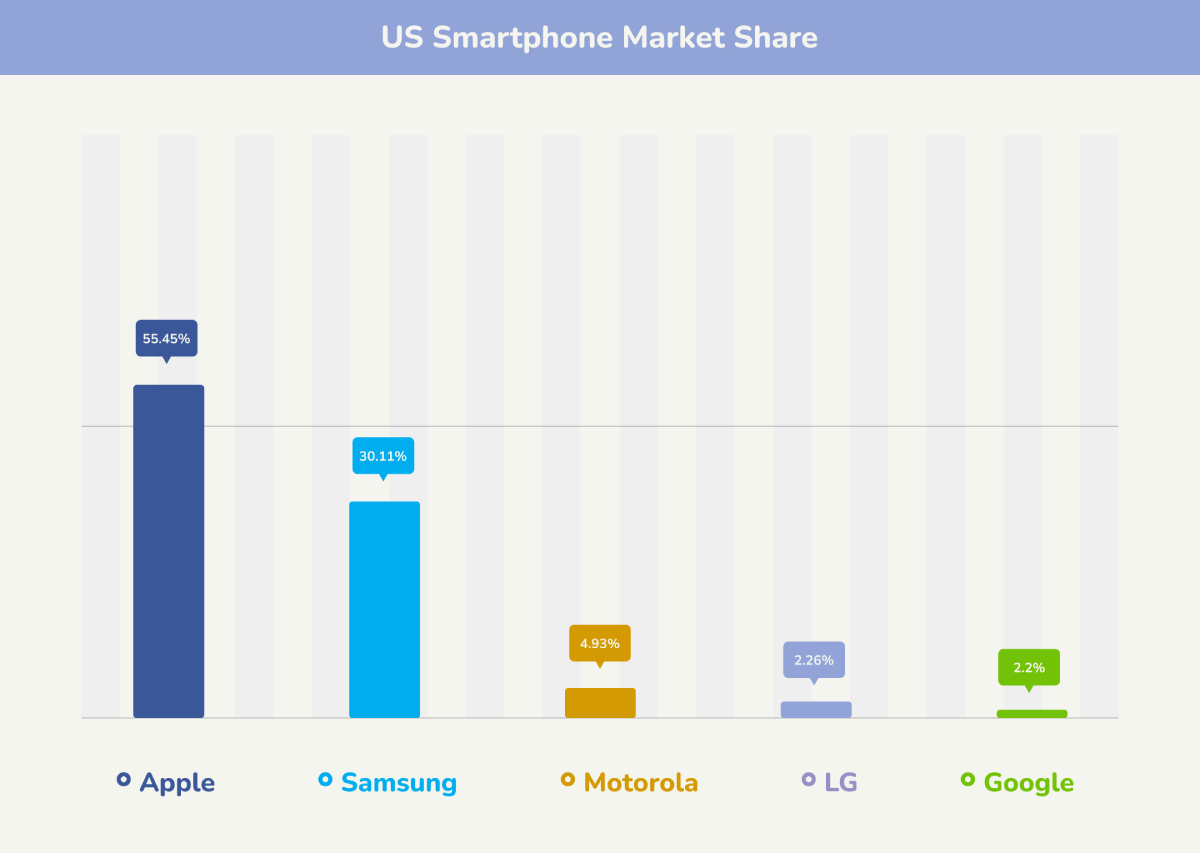
2: But iPhone has a larger Market Share
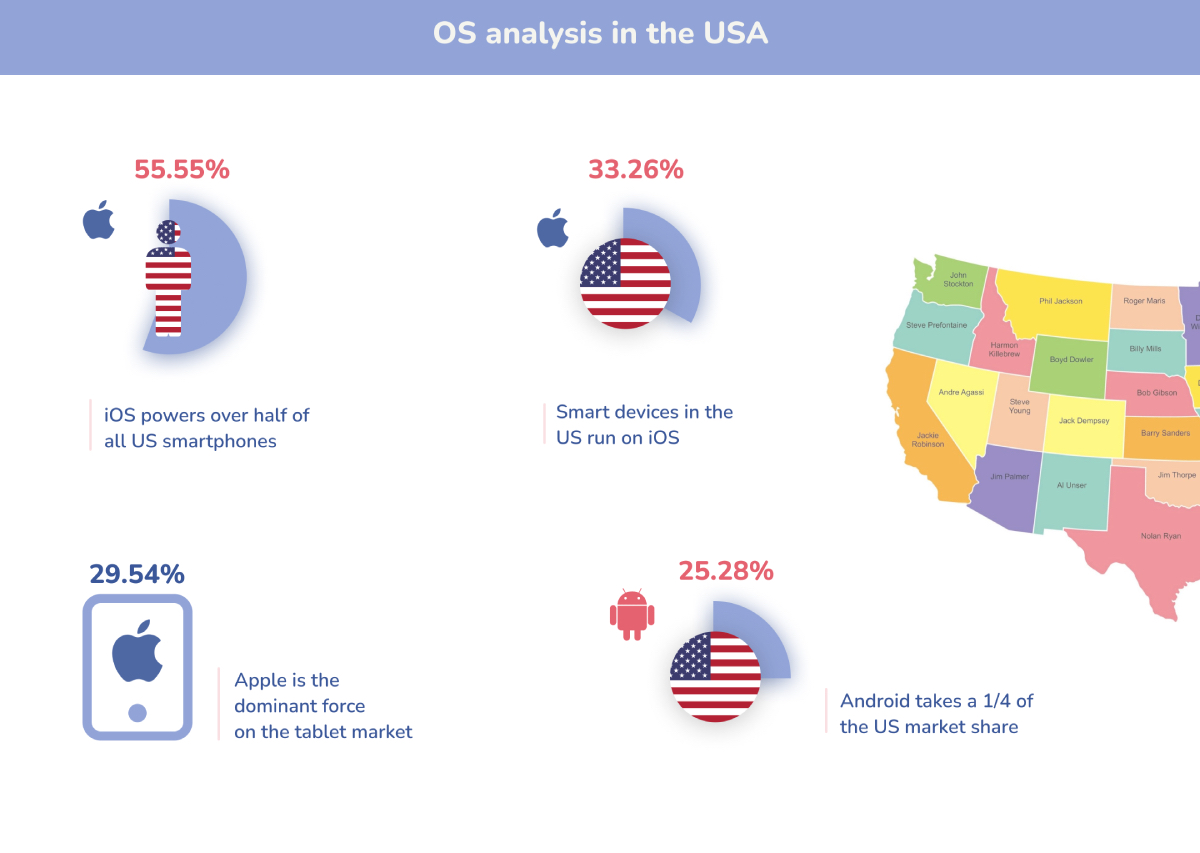
Even though Android is the biggest OS in the world, iPhone holds a lion’s share of the US market. In the second quarter of 2022, it hit an all-time high and crossed the 50% mark (for the first time ever). Interestingly enough, it did not show any signs of slowing down as in the last quarter this number jumped to 55.45%:
3: Android’s market share is growing everywhere across Asia except China
In China, Android has still got the biggest share of OS. The current iOS vs Android market share in China, updated in 2022, is 79% Android and 20% iOS. But according to Statista, Android’s market share was 81% in July 2021. A 2% change in just six months gives a clear picture of Android’s decline in China over a short period.
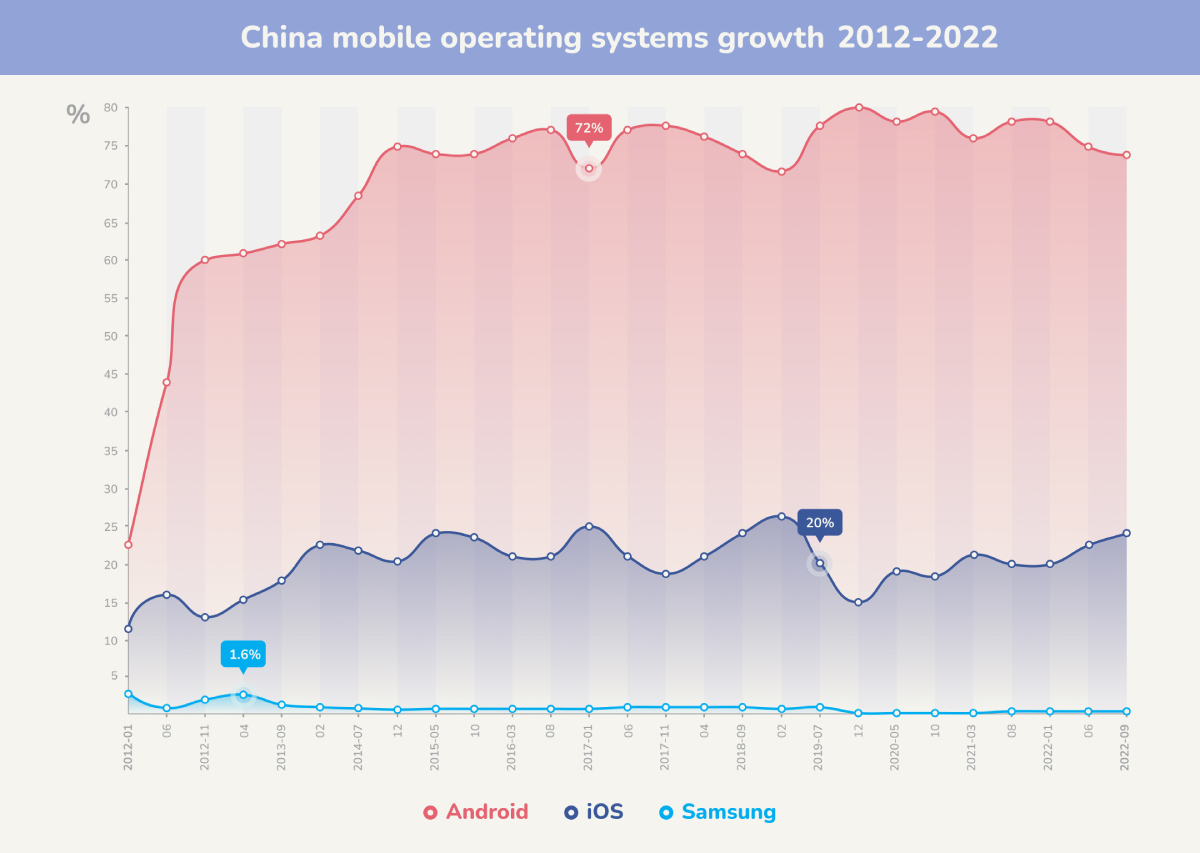
China is the biggest market for mobile phones; and being the biggest OS, Android should be winning there. But there are always political and business rivalries going around when it comes to the Chinese market, reflected by the recent market shifts.
Chinese authorities don’t get along with Google. That’s why they have restricted Google’s access to Chinese markets in different ways. This has resulted in Android’s market share declining and Chinese mobile users are left with alternate options such as Xiaomi, Huawei, OPPO, and other local brands. 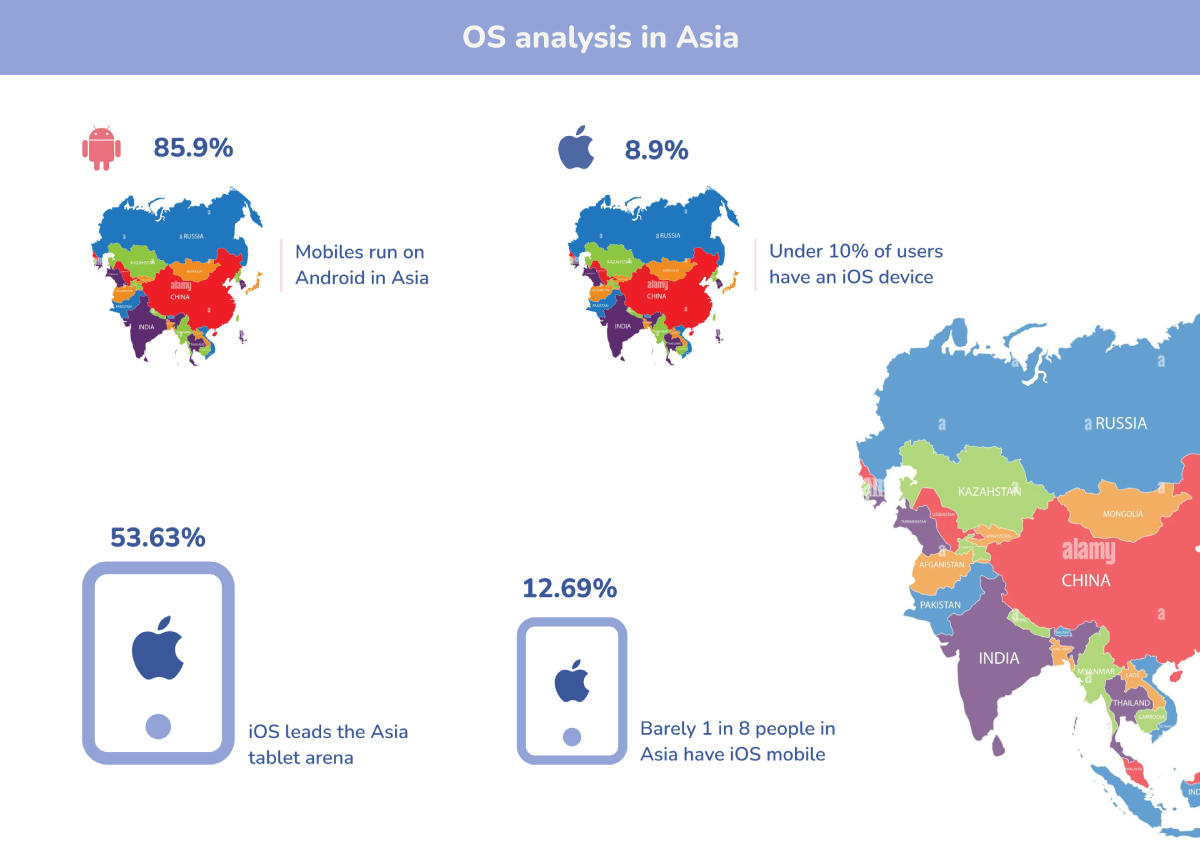
The Chinese picture contrasts with the general trend across Asia, where Android’s dominance is indisputable. Almost 90% of Asian smartphone users have Android devices, completely dominating the Asian mobile market.
However, Apple’s strength in the tablet market powers iOS ahead of Android, with over ½ of tablet users preferring Apple tablets. This corresponds with the wider international market, where around 65% of global citizens using iOS-run tablets.
4: iOS is the people’s choice in developed markets
If you are reading this piece in the US, Japan, and the UK, Android’s global statistics might come as a big surprise for you. Because, according to statistics, there are more chances of you and your friends having an iPhone.
The iOS vs Android market share in the US is 59.17% iOS and 40.54% Android. In Japan, the iOS market share is almost 63%. Similarly, in the UK, iOS beats android by a fine margin. The statistics below about US market shares won’t come as a surprise to many!
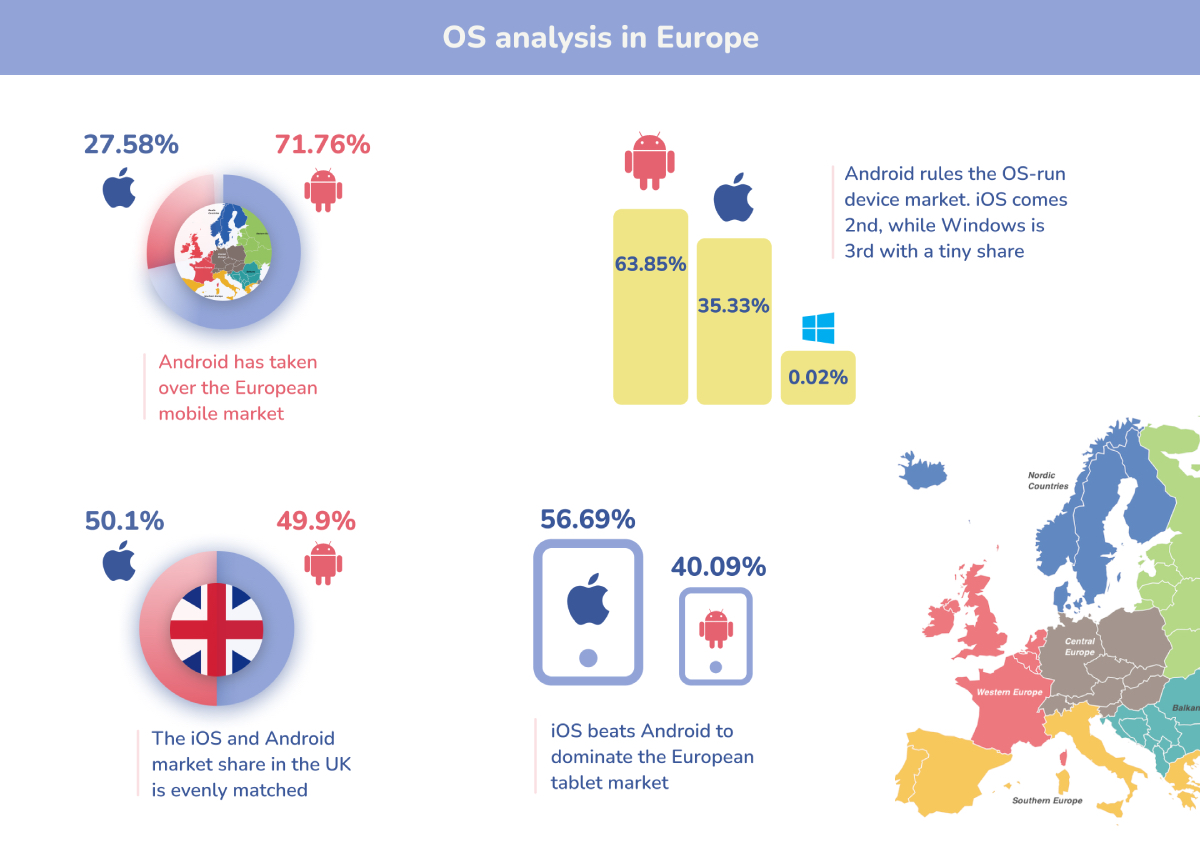
A similar picture is presented in the U.K. – with Apple’s market share at 50.1%. However, Android dominates across Europe, mostly down to its strength in mobile devices. Apple’s share of the European mobile market stands at under 30%, with Android making up over 70% of the local phone market.
The question therefore is why developed markets see such dominance by Apple. We’ve crunched the stats below, with much of Apple’s strength arising from the increased buying power of its consumers.
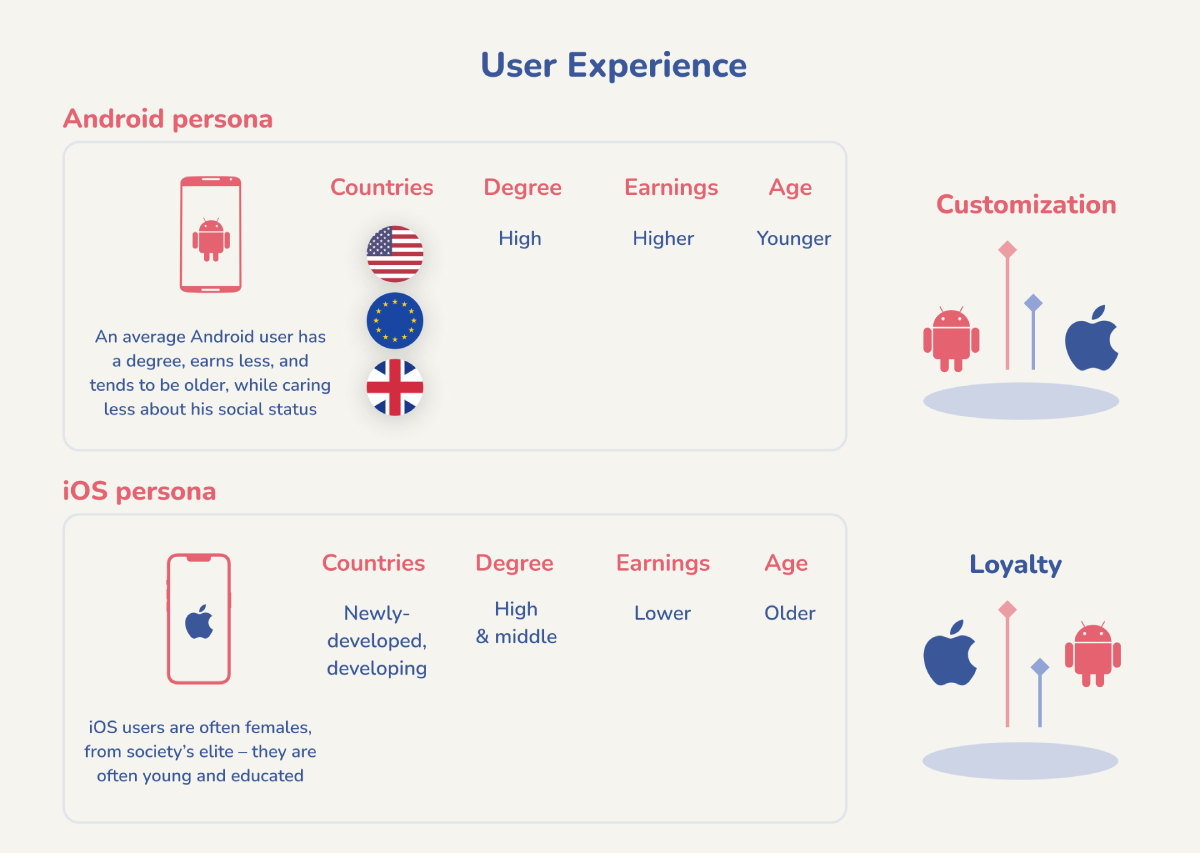
5: Older versions of Android OS still popular among most users
The popularity of older versions of an OS sounds odd because we all want to have the latest version of the OS on our phones. While this is true for iOS, Android user statistics tell us a different story.
In a study published as recently as February 2022, Android versions as old as 2015 were the most popular versions among Android users. 60% of Android users have older versions of Android on their phones.
It’s not that Android’s latest version comes with issues. It’s just that there are tons of Android phone manufacturers and in managing different models, makes, and manufacturers, having the latest version becomes quite a challenge.
iOS users, on the other hand, don’t have any varieties in their manufacturers. In fact, more than 80% of iOS users have the latest iOS version on their phones.
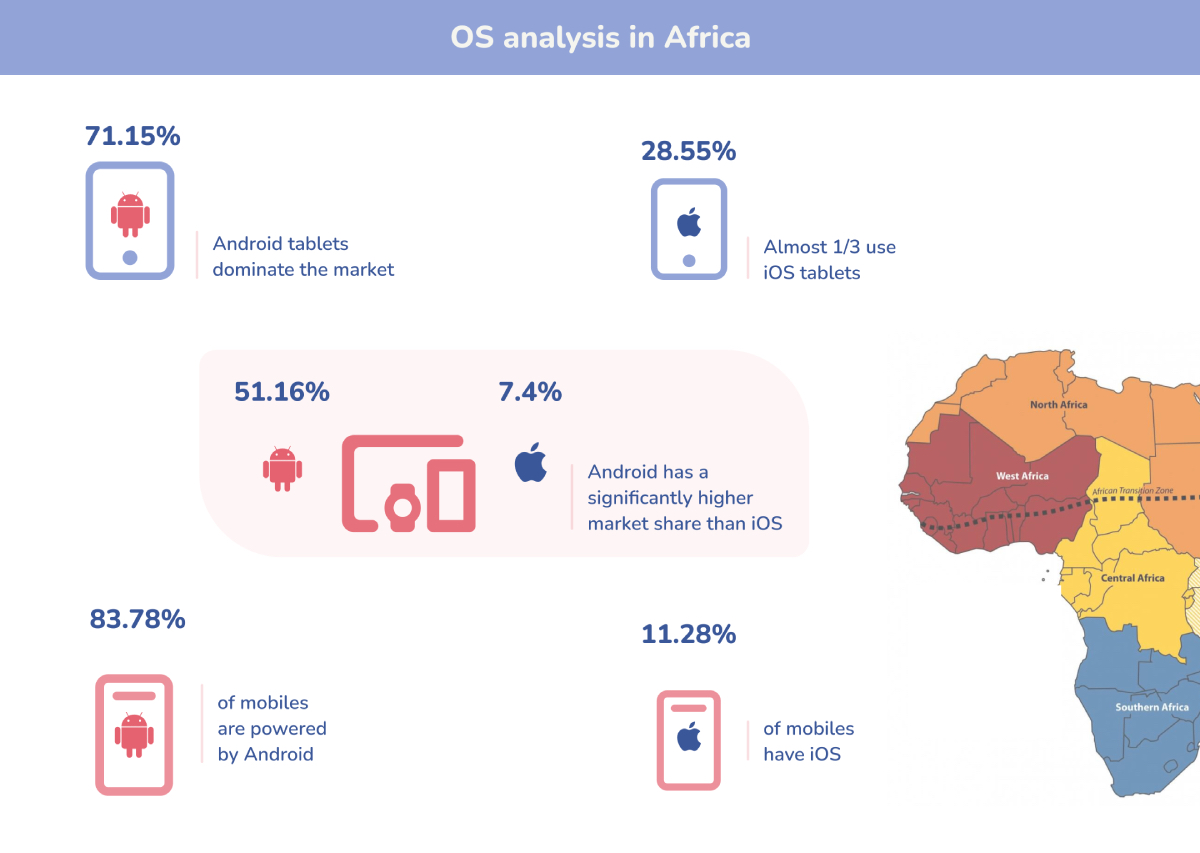
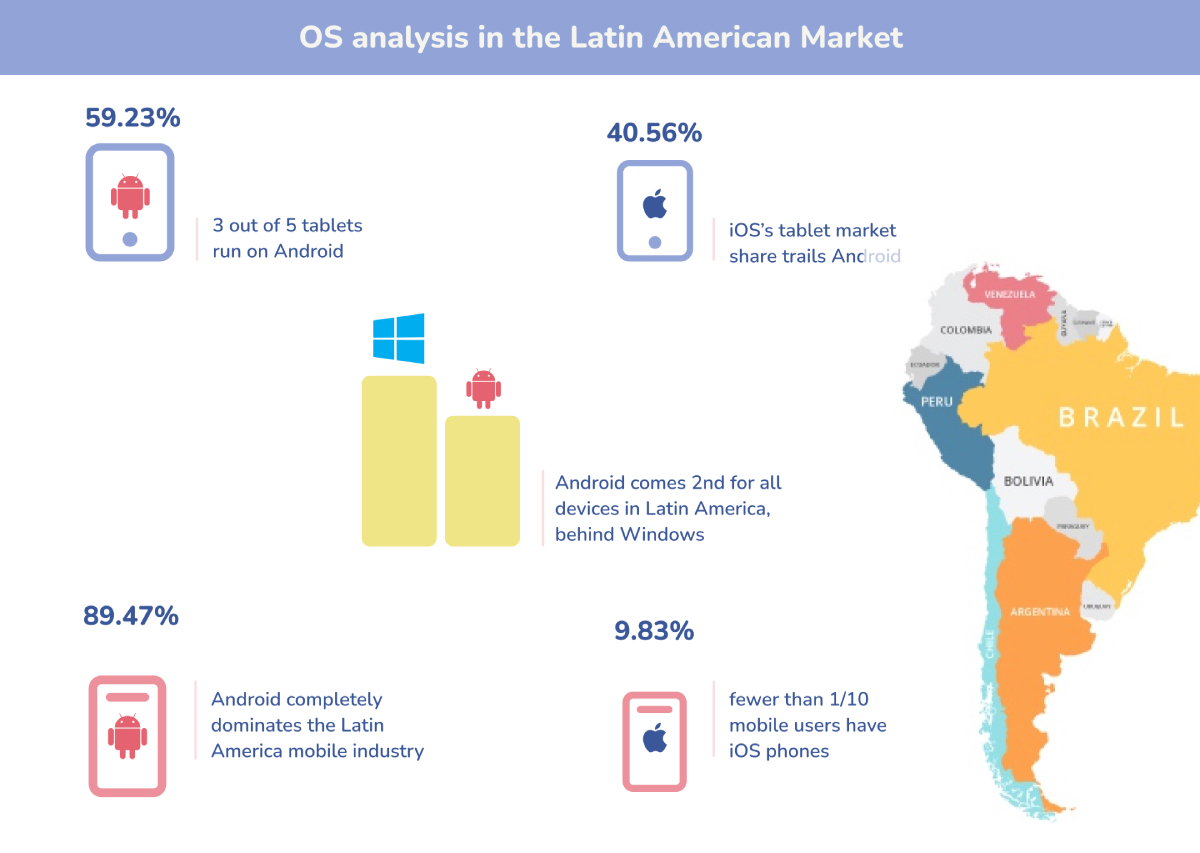
6: Emerging markets and emerging trends
There are matching trends to be drawn across the Latin American and African markets. In both continents, over 8/10 users use Android mobiles, with Apple’s market share in that sphere hovering around 1/10.
This is reflected in Apple’s market share across all devices. In the Latin American Market, Apple hardly makes its way onto the podium, trailing both Windows and Android. Similarly, in the African Market, Apple’s market share stands at a relatively small 7.4%
7: $34 Billion app revenue for Android and iOS in 2021
In the third quarter of 2021, people spent almost $34 Billion on premium apps, in-app purchases, and first-time app installations on Android and iOS.
Despite iOS having 50% less market share than Android, iOS’s revenue was $21.5 billion which is almost twice that of Android’s $12.1 billion.
This highlights an important aspect of the iOS vs Android market share, that winning in books is not that important but the market that you are winning in.
iOS has a considerable lead in the developed markets, which in turn enables it to garner better revenues since users in the developed markets are more capable of spending more on apps.
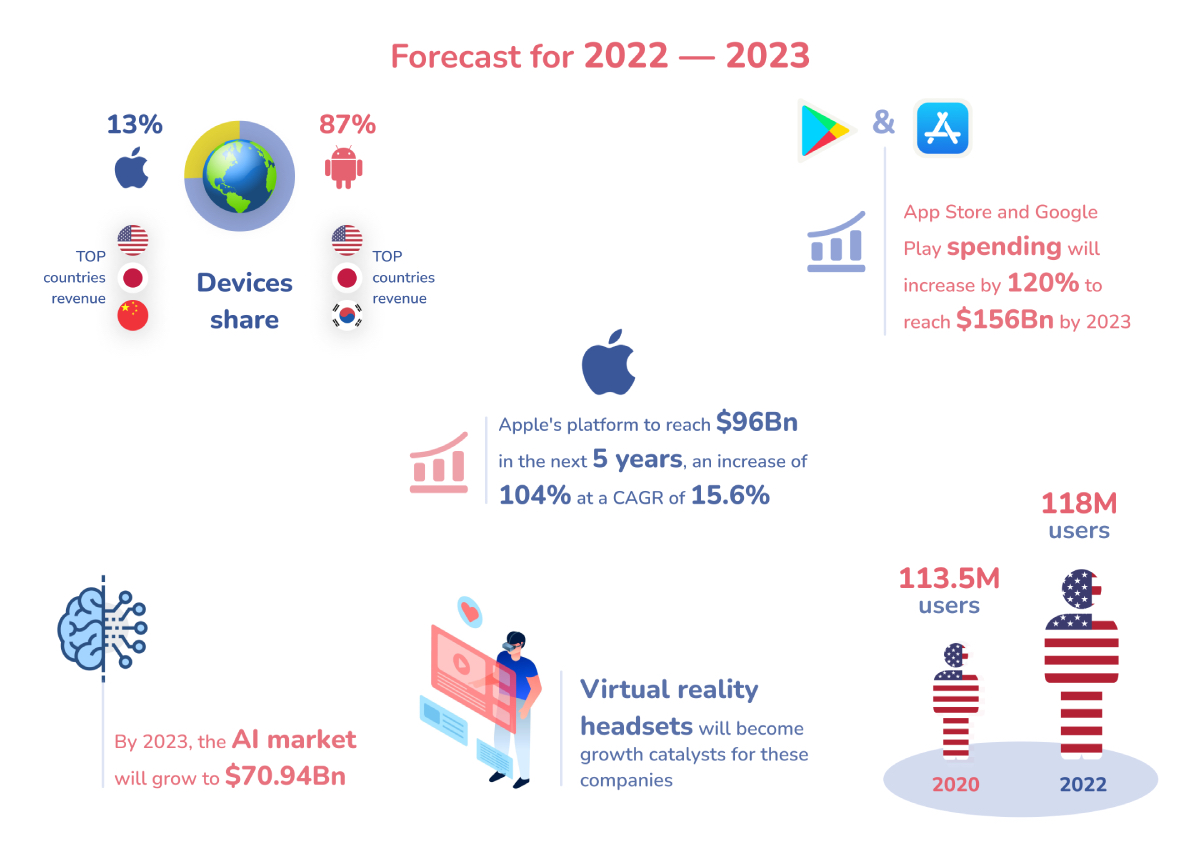
We see similar pictures emerge across forecasts for 2022-2023, with a projected App Store and Google Play combined revenue of over $150 billion.
8: The revenue story – OS gaming numbers
It won’t come as a surprise at this point to hear that both Apple and Android’s revenue is well into the billions, with accelerated revenue growth in all regions. Projected growth in the US for both Android and Apple is over 100% across the 2020s.

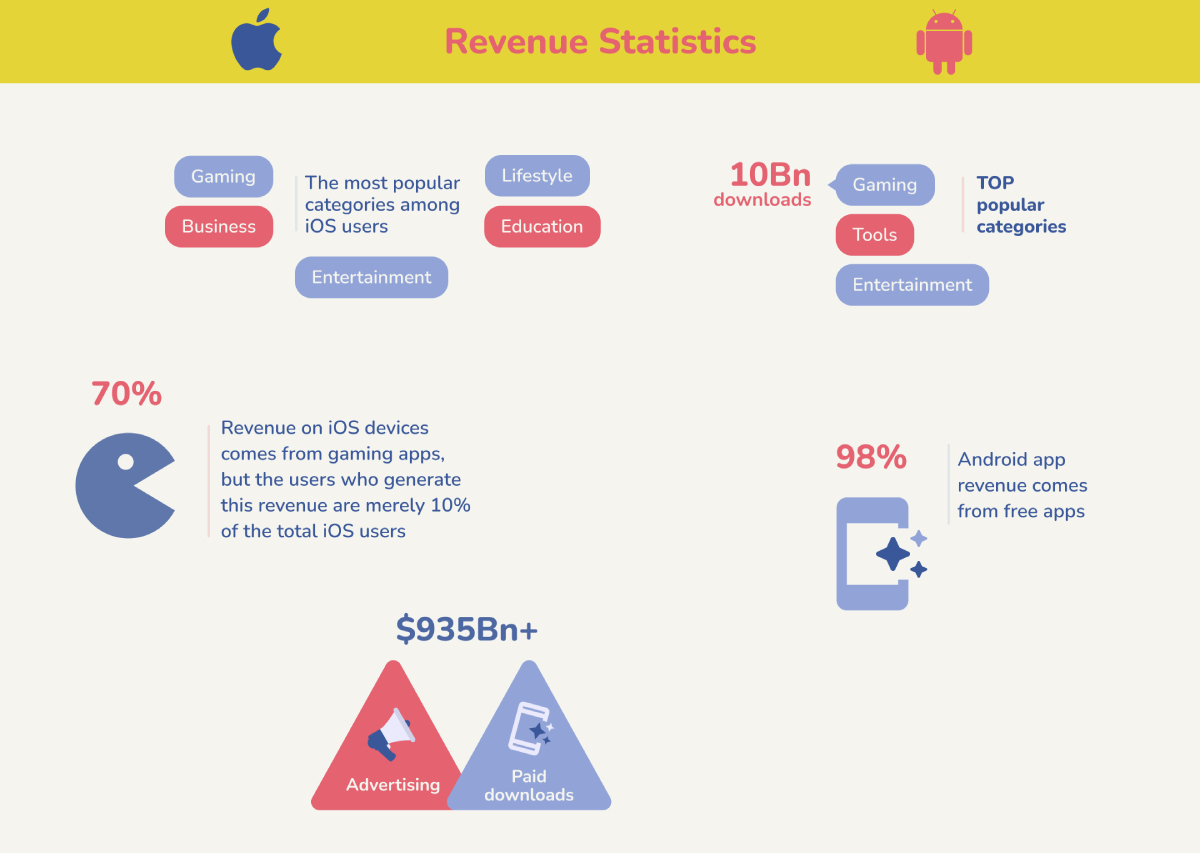
The question then is how Android and Apple source this revenue. Perhaps surprisingly, gaming revenue makes up a significant portion of each company’s profits. Around 70% of Apple’s on-device revenue comes from gaming apps. Across the two OSs, there were a staggering 10 billion gaming-related downloads.
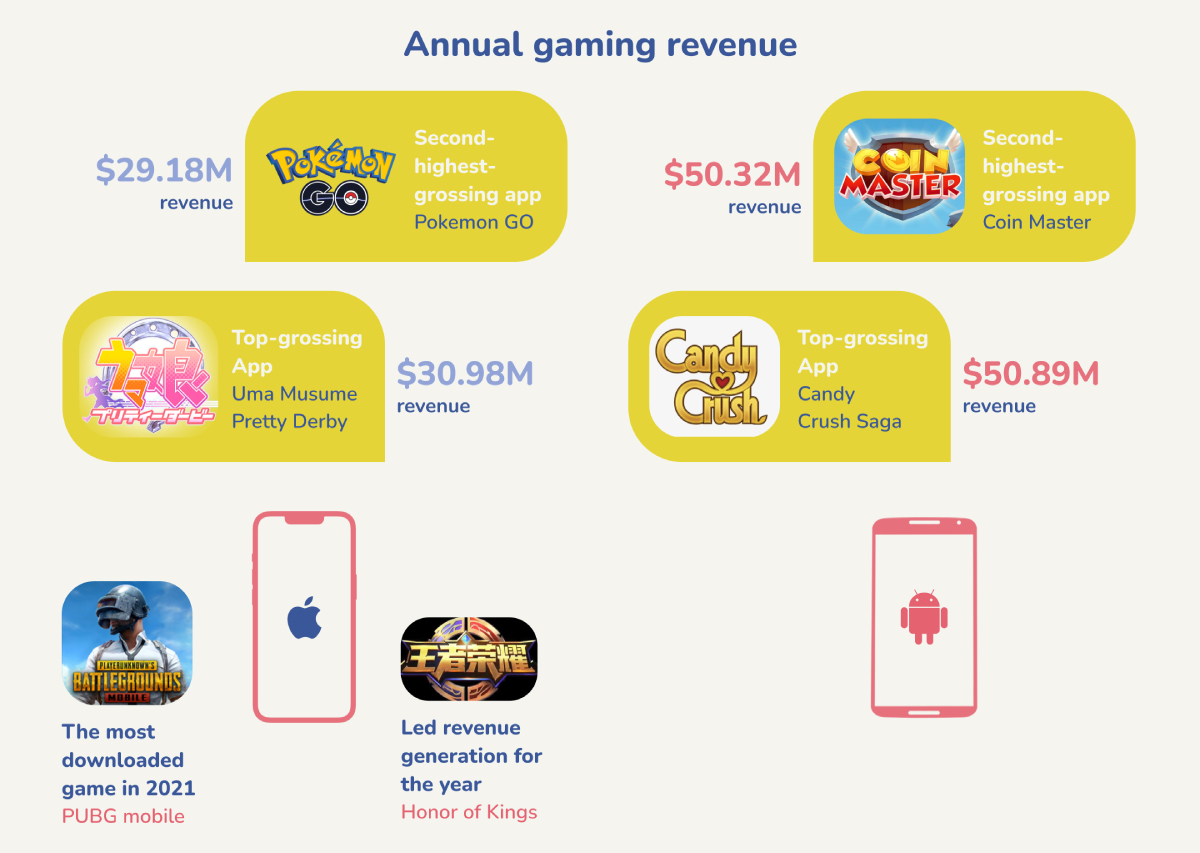
Given Android’s greater international market share, its gaming revenue surpasses Apple’s on leading apps – with Android’s top-grossing app bringing in over $50 million dollars per year.
Android vs iOS market share discoveries in 2022 – infographic
- Globally, 72.73% of mobiles run on Android while 26.99% have iOS.
- iOS is the leader in the US market with a 33.26% OS share across all devices.
- The Asian market is dominated by Android. 85.9% of phones in Asia are Android phones.
- The iOS vs Android market share game in the UK stands even, with Android just leading by fine margins. 50.1% market share for Android, and 49.9% is the iOS market share.
- Android leads the African and Latin American OS market with almost 90% share in the mobile OS market.
- Android has over 3 million apps on Google Play, and iOS App Store has about 2 million. However, the app revenue of iOS is more than that of Android.
- In 2 years, Android will capture 87% of the global OS market.
Final thoughts
When it comes to mobile OS global market share, Android and iOS are the only two real global players.
From the above statistics we see here, it is clear that Android’s policy is to maximize market penetration and reach maximum users. In contrast, iOS tends to keep a revenue-centric presence in developed markets.
Android wins the iOS vs Android market share game, but iOS makes it even by having a much better revenue stream.
And as we delve into the future of Artificial Intelligence and Augmented Reality, we only see the two OSs booming; both giants are already preparing well ahead of the game.
Full size infographic:
